DeTox 初体验
这里简要记录下尝试 run detox 这个项目的艰辛历程。
(Redis 和 PostgreSQL 的配置由于没有太多能遇到的问题,这里就省略了,不过还是说一句,DeTox 的 redis 使用 jemalloc 库编译无法通过,只能使用 libc 的 malloc,而我试了下官方的 redis 库是没有这个问题的)
Redis 和 PostgreSQL 配置好后分别让它们运行在默认端口。
装好 maven 工具,根据提示,依次执行:
cd sys
mvn clean install
mvn assembly:single
此时会在 target 目录下生成 TaoBench1012.jar。猜测项目默认是运行 TAOBench。
通过 pom.xml 文件,大概可以猜测入口在 StartTaoBenchTrxClient.java。
<artifactId>maven-assembly-plugin</artifactId>
<configuration>
    <finalName>TaoBench1012</finalName>
    <appendAssemblyId>false</appendAssemblyId>
    <archive>
        <manifest>
       <mainClass>shield.benchmarks.taobench.StartTaoBenchTrxClient</mainClass>
        </manifest>
接下来,README.md 提示需要你配置 ____ExpConfig.json。很遗憾的是我搜索了整个项目文件夹,它并没提供一个示例文件,README.md 里仅仅提供了参数名但是没有给参数的可选值或者范围。
之后,我将一步步尝试通过 Debug 代码的方法来补全所需要的参数。通过一步步跳转,最后在 NodeConfiguration.java 里找到了解析 JSON 的函数:public void loadProperties(String fileName)。在 NodeConfiguration 这个类中,它定义了很多配置参数,部分如下:
  public String REDIS_HOSTNAME = "localhost";
  public String REDIS_PORT = "6379";
  public boolean REDIS_ENABLED = true;
  public boolean REDIS_PREFETCH = true;
  public long LATENCY = 0;

  public String POSTGRES_HOSTNAME = "";
  public String POSTGRES_PORT = "5432";
  public String POSTGRES_USERNAME = "admin";
  public String POSTGRES_PASSWORD = "password";
  public String POSTGRES_DB_NAME = "benchmark";
其中的很多参数在 README.md 都没有提及,可以根据代码在 JSON 文件中添加对应配置项,或者直接更改这里的配置代码。至少数据库信息必须要和自己的环境对应上。配置文件我基本上都填的代码里它给的默认参数:
{
    "threads": "1",
    "req_threads_per_bm_thread": "3",
    "exp_length": "90",
    "postgres_hostname": "localhost",
    "redis_hostname": "localhost",
    "redis_enabled": true,
    "redis_prefetch": true,
}
尝试 run,
java -jar TaoBench1012.jar ____ExpConfig.json
会提示空指针异常,
Exception in thread "main" java.lang.NullPointerException
        at shield.benchmarks.taobench.StartTaoBenchTrxClient.main(StartTaoBenchTrxClient.java:136)
通过 Debug 可以发现,配置文件没有加载成功,在 RedisPostgresClient client = (RedisPostgresClient) ClientUtils.createClient(tpcConfig.CLIENT_TYPE, expConfigFile, keyLocks, 7000 + this.threadNumber, this.threadNumber); 处就已经抛出异常了,但是作者的代码 在这里捕获到异常后并没有做任何提示和处理,导致错误推迟到 main 里的 136 行才发现。
此处省略漫长的调试过程。经过调试之后,发现配置文件里还需要增添 client_type 这一项(README.md 中没有提及),另外 JSON 的布尔值需要加上引号。得到最终的参考配置文件如下:
{
    "threads": "1",
    "req_threads_per_bm_thread": "3",
    "exp_length": "90",
    "postgres_hostname": "localhost",
    "redis_hostname": "localhost",
    "redis_enabled": "true",
    "redis_prefetch": "true",
    "client_type": "redis-postgres"
}
此时尝试 run,很遗憾的是在经过一些输出信息后,你还是会看到上面提到的在 136 行处发生空指针异常。再经过一番 Debug,发现需要把 RedisPostgresClient 类中的 USE_SQL 改为 true。代码中有如下注释:
/**
* Indicates whether we send SQL requests to postgres or KV requests to TiKV
*
* TODO: move this to config
*/
private static boolean USE_SQL = true;
我使用的 PostgreSQL,不是 TiKV,故需要把 USE_SQL 改为 true。这部分作者也是说了,还未在配置文件中实现。
此时再尝试 run,会在 JDBC 连接数据库的时候,得到了如下错误:
jdbc:postgresql://localhost:5432/benchmark?user=admin&password=password
org.postgresql.util.PSQLException: The authentication type 10 is not supported. Check that you have configured the pg_hba.conf file to include the client's IP address or subnet, and that it is using an authentication scheme supported by the driver.
0
The authentication type 10 is not supported. Check that you have configured the pg_hba.conf file to include the client's IP address or subnet, and that it is using an authentication scheme supported by the driver.
经过搜索,大概原因是 JDBC 驱动版本太低了,不支持 SCRAM-SHA-256 密码验证。PostgreSQL 从版本 10 开始默认使用 SCRAM-SHA-256 替代了以前的 MD5。解决办法是把 pom.xml 里的 JDBC 驱动依赖替换为如下代码,使用最新的 JDBC 驱动:
<dependency>
    <groupId>org.postgresql</groupId>
    <artifactId>postgresql</artifactId>
    <version>42.7.0</version>
</dependency>
此时再次尝试运行,我们发现在 SQL 执行过程中会报错,通过 Debug,我捕获到了它执行的 SQL 语句实例:
SELECT data FROM objects WHERE id = 8401207877630507191;
奇怪,在 TAOBench 的 objects 表里并没有 data 这一列,只有 value 的列。我猜想会不会 Detox 代码里的列名 data 就对应着 TAOBench 文档里的 value 呢?于是我把 edges 和 objects 表中的列名修改了一下,再次尝试 run。依然是 SQL 执行粗我,得到的错误如下:
ERROR: relation "objects" already exists
org.postgresql.util.PSQLException: ERROR: current transaction is aborted, commands ignored until end of transaction block
        at org.postgresql.core.v3.QueryExecutorImpl.receiveErrorResponse(QueryExecutorImpl.java:2712)
        at org.postgresql.core.v3.QueryExecutorImpl.processResults(QueryExecutorImpl.java:2400)
        at org.postgresql.core.v3.QueryExecutorImpl.execute(QueryExecutorImpl.java:367)
        at org.postgresql.jdbc.PgStatement.executeInternal(PgStatement.java:507)
        at org.postgresql.jdbc.PgStatement.execute(PgStatement.java:424)
        at org.postgresql.jdbc.PgPreparedStatement.executeWithFlags(PgPreparedStatement.java:190)
        at org.postgresql.jdbc.PgPreparedStatement.execute(PgPreparedStatement.java:177)
        at shield.client.RedisPostgresClient$ExecuteOpRunnable.run(RedisPostgresClient.java:886)
        at java.base/java.util.concurrent.ThreadPoolExecutor.runWorker(ThreadPoolExecutor.java:1128)
        at java.base/java.util.concurrent.ThreadPoolExecutor$Worker.run(ThreadPoolExecutor.java:628)
        at java.base/java.lang.Thread.run(Thread.java:829)
Caused by: org.postgresql.util.PSQLException: ERROR: relation "objects" already exists
        at org.postgresql.core.v3.QueryExecutorImpl.receiveErrorResponse(QueryExecutorImpl.java:2712)
        at org.postgresql.core.v3.QueryExecutorImpl.processResults(QueryExecutorImpl.java:2400)
        at org.postgresql.core.v3.QueryExecutorImpl.execute(QueryExecutorImpl.java:367)
        at org.postgresql.jdbc.PgStatement.executeInternal(PgStatement.java:507)
        at org.postgresql.jdbc.PgStatement.execute(PgStatement.java:424)
        at org.postgresql.jdbc.PgStatement.executeWithFlags(PgStatement.java:344)
        at org.postgresql.jdbc.PgStatement.executeCachedSql(PgStatement.java:330)
        at org.postgresql.jdbc.PgStatement.executeWithFlags(PgStatement.java:306)
        at org.postgresql.jdbc.PgStatement.executeUpdate(PgStatement.java:279)
        at shield.client.RedisPostgresClient.createTable(RedisPostgresClient.java:288)
        at shield.client.RedisPostgresClient.createReadStatement(RedisPostgresClient.java:327)
        at shield.client.RedisPostgresClient.read(RedisPostgresClient.java:464)
        at shield.benchmarks.taobench.ReadScan.tryRun(ReadScan.java:63)
        at shield.benchmarks.utils.BenchmarkTransaction.run(BenchmarkTransaction.java:28)
        at shield.benchmarks.taobench.TaoBenchGenerator.runNextTransaction(TaoBenchGenerator.java:95)
        at shield.benchmarks.taobench.StartTaoBenchTrxClient$BenchmarkRunnable.run(StartTaoBenchTrxClient.java:82)
        ... 1 more
Aborting!
大概的核心错误就是 ERROR: relation "objects" already exists。这是什么意思呢?经过一番 Debug,我发现原来它代码自己会创建 table,不需要你自己创建好 table。在 RedisPostgresClient 类里你可以找到如下代码:
String createTable = (
      "CREATE TABLE " + tableName +
              "(id BIGINT not null, " +
              "data VARCHAR," +
              "PRIMARY KEY (id))");
然我把创建的两个 table 都 drop 了,再次 run 终于成功了。经过了两分半钟的等待,得到的结果如下:
❯ java -jar TaoBench1012.jar ____ExpConfig.json
Storage:
Storage:
Creating NM localhost 7000
sender set up threads 1
log4j:WARN No appenders could be found for logger (io.netty.util.internal.logging.InternalLoggerFactory).
log4j:WARN Please initialize the log4j system properly.
log4j:WARN See http://logging.apache.org/log4j/1.2/faq.html#noconfig for more info.
WARNING: An illegal reflective access operation has occurred
WARNING: Illegal reflective access by io.netty.util.internal.ReflectionUtil (file:/home/lrl52/project/detox/sys/target/TaoBench1012.jar) to constructor java.nio.DirectByteBuffer(long,int)
WARNING: Please consider reporting this to the maintainers of io.netty.util.internal.ReflectionUtil
WARNING: Use --illegal-access=warn to enable warnings of further illegal reflective access operations
WARNING: All illegal access operations will be denied in a future release
Waiting to Bound
Bound localhost/127.0.0.1:7000
Initialising Clients
Loading driver...
Driver loaded!
Connection jdbc:postgresql://localhost:5432/benchmark?user=admin&password=password
Client registered
105
113
Begin Client 01700657077932
[STAT] READ 177961 0 0 0.35055435
[STAT] UPDATE 0 0 0 NaN
[STAT] SCAN 52429 0 0 1.2124397
[STAT] WRITE 0 0 0 NaN
[STAT] WRITETRANSACTION 0 0 0 NaN
[STAT] READTRANSACTION 76629 0 0 0.5060486
THREADS COMBINED STATS
Benchmark duration: 90
[STAT] READ 177961 0 0 0.35055435
[STAT] UPDATE 0 0 0 NaN
[STAT] SCAN 52429 0 0 1.2124397
[STAT] WRITE 0 0 0 NaN
[STAT] WRITETRANSACTION 0 0 0 NaN
[STAT] READTRANSACTION 76629 0 0 0.5060486

Average throughput: 3411 txn/s
Average latency: 0.5365466ms

475775 layers sped up out of 484980 layers total; 0.981
475775 layers had all reads sped up out of 484980 layers total; 0.981. 0 of these layers were write-only.
4785866 requests cached out of 4795521 requests total; 0.998
Of 349104 prefetches made total, 171084 (0.490) were used, 349104 (1.000) were redundant, 171084 (0.490) were used AND redundant
DeTox 终于勉强能跑了。不过目前仍有两个问题没有解决:
- DeTox 是如何跑 TAOBench 的,这里似乎并没有用到 TAOBench 项目的任何东西?
- DeTox 该如何作为中间层跑起来并处理请求,从而实现缓存控制?
TAOBench 初体验
官方文档:TAOBench Docs
TAOBench 的 Adapter Layers 目前支持的数据库有如下:
- Cloud Spanner
- MySQL and MySQL-compatible databases
- Postgres-compatible databases
看了下使用文档,由于笔者仅使用过 MySQL 和 PostgreSQL,而 PostgreSQL 的文档中主要是以 CockroachDB 为例来讲的,不太确定纯 PostgreSQL 能不能跑起来,所以笔者打算用 MySQL 来试验一下。
这里笔者踩了个坑,开始尝试在 Ubuntu 22.04 上编译 TAOBench,却怎么都无法编译通过,原因是 TAOBench 依赖 SuperiorMySqlpp — A C++ wrapper for the MySQL C API。而 SuperiorMySqlpp 依赖的 MySQL C API (对应 libmysqlclient-dev)仅支持 Ubuntu 18.04 的旧版本,否则编译的时候会因为 C API 不兼容无法成功。于是我尝试在 Ubuntu Archive 上下载 libmysqlclient-dev 的旧版手动安装,很遗憾的是依然无法安装成功。
由于兼容性问题无法解决,笔者用 Docker 拉取 Ubuntu 18.04 镜像来运行 TAOBench。
docker pull ubuntu:18.04
然后配置环境,
apt update
add-apt-repository -y ppa:ubuntu-toolchain-r/test
apt install build-essential cmake g++-11
apt install software-properties-common
apt install libmysqlclient-dev
git clone https://github.com/seznam/SuperiorMySqlpp
cp -Rf SuperiorMySqlpp/include/* /usr/include
编译 TAOBench,
mkdir build
cd build/
cmake .. -DWITH_MYSQL=ON
make -j
此时就得到了可执行文件 taobench。
由于 MySQL 5.7 在 Ubuntu 22.04 下安装麻烦,同理使用 Docker 来拉取。
docker run --name mysql5.7-db -v /data/mysql:/var/lib/mysql -e MYSQL_ROOT_PASSWORD=123456 -d -p 3306:3306 mysql:5.7
为了让 ubuntu18.04 容器能够访问到 mysql5.7-db,我们创建一个新网络并把它俩并入同一个 docker network。
docker network create net
docker network connect net ubuntu18.04
docker network connect net mysql5.7-db
这样在 ubuntu18.04 容器内就可以直接通过 host 名 mysql5.7-db 来访问到 MySQL 了。
通过 DataGrip 连接到 MySQL 5.7,创建 TAOBench 所需的数据库和表,
create database benchmark;
use benchmark;
CREATE TABLE objects(
    id BIGINT PRIMARY KEY,
    timestamp BIGINT,
    value VARCHAR(150));
CREATE TABLE edges(
    id1 BIGINT,
    id2 BIGINT,
    type BIGINT,
    timestamp BIGINT,
    value VARCHAR(150),
    PRIMARY KEY CLUSTERED (id1, id2, type));
编辑 mysql_db.properties,配置数据库连接信息,
mysqldb.dbname=benchmark
mysqldb.url=mysql5.7-db
mysqldb.username=root
mysqldb.password=123456
mysqldb.dbport=3306
接下来就可以跑 TAObench 了,编辑 experiments.txt 配置请求线程数、预热时间和实验时间,这里我设置的比较小,
# This is an example experiment file.
#
# The format of each line is:
#   num_threads,warmup_len,exp_len
#
# The lengths are in seconds. During the warmup period,
# the benchmark runs the workload but does not record
# outcomes.
#
# Have fun experimenting with TAOBench!
16,5,30
然后运行 taobench 进行 load data,插入实验所需的数据,
./taobench -load-threads 16 -db mysql \
           -p mysqldb/mysql_db.properties -c src/workload_o.json \
           -load -n 5000
taobench 的具体参数如下:
-load: Run the batch insert phase of the workload.-run: Run the transactions phase of the workload.-load-threads <n>: Number of threads for batch inserts (load) or batch reads (run) (default: 1).-db <dbname>: Specify the name of the DB adapter layer to use (default: basic). Supported names arecrdb,mysql,spanner, andyugabytedb.-p <propertyfile>: Load properties from the given file. Multiple files can be specified, and will be processed in the order specified.-c <configfile>: Load workload config from the given file.-e <experimentfile>: Each line gives number of threads, warmup length, and experiment length.-property <name>=<value>: Specify a property to be passed to the DB and workloads multiple properties can be specified, and override any values in the propertyfile.-s: Print status every 10 seconds (use status.interval prop to override).-n: Number of edges in key pool (default: 165 million) to batch insert.-spin: Spin on waits rather than sleeping.
结果如下,
running benchmark!
Running batch insert phase!
Created DBs
5000
Number of failed batch inserts: 0
Done with batch insert phase!
这时去查看数据表,可以发现表中已经填满了数据,
然后第二次跑 taobench,run experiments,
./taobench -load-threads 16 -db mysql \
           -p mysqldb/mysql_db.properties -c src/workload_o.json \
           -run -e experiments.txt
在经过几分钟的等待后,结果如下:
running benchmark!
Inputted experiments:
Running experiment: 16 threads, 5 seconds (warmup), 30 seconds (experiment)
finished initializing DBs
begin: 0, end: 576460752303423488
begin: 432345564227567616, end: 1008806316530991104
begin: 864691128455135232, end: 1297036692682702848
begin: 1297036692682702848, end: 1729382256910270464
begin: 1729382256910270464, end: 2161727821137838080
begin: 2161727821137838080, end: 2594073385365405696
begin: 2594073385365405696, end: 3026418949592973312
begin: 3026418949592973312, end: 3458764513820540928
begin: 3458764513820540928, end: 3891110078048108544
begin: 3891110078048108544, end: 4323455642275676160
begin: 4323455642275676160, end: 4755801206503243776
begin: 4755801206503243776, end: 5188146770730811392
begin: 5188146770730811392, end: 5620492334958379008
begin: 5620492334958379008, end: 6052837899185946624
begin: 6052837899185946624, end: 6485183463413514240
begin: 6485183463413514240, end: 6917529027641081856
loaders
num read by thread: 335
num read by thread: 309
num read by thread: 319
num read by thread: 296
num read by thread: 364
num read by thread: 287
num read by thread: 299
num read by thread: 304
num read by thread: 295
num read by thread: 289
num read by thread: 299
num read by thread: 289
num read by thread: 388
num read by thread: 286
num read by thread: 296
num read by thread: 316
Number of failed batch reads: 0
Done with batch read phase!
Total edges read: 4971
Sleeping after batch reads.
Running experiment: 16 threads, 5 seconds (warmup), 30 seconds (experiment)
Sleeping after sending DB connections.
2023-11-17 16:53:02 0 sec: 0 operations; [WRITE: Count=0 Max=0.00 Min=179769313486231570814527423731704356798070567525844996598917476803157260780028538760589558632766878171540458953514382464234321326889464182768467546703537516986049910576551282076245490090389328944075868508455133942304583236903222948165808559332123348274797826204144723168738177180919299881250404026184124858368.00 Avg=0.00]
2023-11-17 16:53:12 10 sec: 1 operations; [READ: Count=1 Max=112.59 Min=112.59 Avg=112.59] [WRITE: Count=0 Max=0.00 Min=179769313486231570814527423731704356798070567525844996598917476803157260780028538760589558632766878171540458953514382464234321326889464182768467546703537516986049910576551282076245490090389328944075868508455133942304583236903222948165808559332123348274797826204144723168738177180919299881250404026184124858368.00 Avg=0.00]
2023-11-17 16:53:22 20 sec: 811812 operations; [INSERT: Count=628 Max=25756.55 Min=1185.60 Avg=3711.92] [READ: Count=786991 Max=25744.78 Min=80.69 Avg=137.72] [UPDATE: Count=1134 Max=27150.13 Min=1226.83 Avg=3719.84] [READTRANSACTION: Count=22965 Max=39988.48 Min=185.53 Avg=1548.36] [WRITETRANSACTION: Count=94 Max=15581.45 Min=1614.15 Avg=4068.60] [WRITE: Count=1762 Max=27150.13 Min=1185.60 Avg=3717.02]
2023-11-17 16:53:32 30 sec: 1582076 operations; [INSERT: Count=1203 Max=40720.99 Min=1185.60 Avg=3748.32] [READ: Count=1534015 Max=29337.78 Min=80.69 Avg=142.47] [UPDATE: Count=2225 Max=28452.47 Min=1226.83 Avg=3780.69] [READTRANSACTION: Count=44471 Max=47165.71 Min=185.53 Avg=1572.55] [WRITETRANSACTION: Count=162 Max=30609.28 Min=1614.15 Avg=4388.99] [WRITE: Count=3428 Max=40720.99 Min=1185.60 Avg=3769.33]
2023-11-17 16:53:32 30 sec: 1582095 operations; [INSERT: Count=1203 Max=40720.99 Min=1185.60 Avg=3748.32] [READ: Count=1534032 Max=29337.78 Min=80.69 Avg=142.47] [UPDATE: Count=2225 Max=28452.47 Min=1226.83 Avg=3780.69] [READTRANSACTION: Count=44473 Max=47165.71 Min=185.53 Avg=1573.40] [WRITETRANSACTION: Count=162 Max=30609.28 Min=1614.15 Avg=4388.99] [WRITE: Count=3428 Max=40720.99 Min=1185.60 Avg=3769.33]
Experiment description: 16 threads, 5 seconds (warmup), 30 seconds (experiment)
Total runtime (sec): 30.0087
Runtime excluding warmup (sec): 20.0085
Total completed operations excluding warmup: 1582095
Throughput excluding warmup: 79071.3
Number of overtime operations: 2326795
Number of failed operations: 0
1582095 operations; [INSERT: Count=1203 Max=40720.99 Min=1185.60 Avg=3748.32] [READ: Count=1534032 Max=29337.78 Min=80.69 Avg=142.47] [UPDATE: Count=2225 Max=28452.47 Min=1226.83 Avg=3780.69] [READTRANSACTION: Count=44473 Max=47165.71 Min=185.53 Avg=1573.40] [WRITETRANSACTION: Count=162 Max=30609.28 Min=1614.15 Avg=4388.99] [WRITE: Count=3428 Max=40720.99 Min=1185.60 Avg=3769.33]
最后一行描述了操作延迟。 Count是已完成操作的数量。 Max、Min和Avg是以微秒为单位的延迟。 WRITE 操作类别是插入/更新/删除的合集。
TAOBench 的 query
如何才能知道 TAObench 在请求的 query 具体是什么呢?从事务缓存那篇 paper 中我记得作者说 TAOBench 无法得知 application code,只能通过 levels 的办法来测试。查了下资料,可以通过 MySQL 的查询日志(General Query Log)来得知具体请求的 SQL 语句。
MySQL 临时打开查询日志,
SHOW VARIABLES LIKE 'general%';
SET GLOBAL general_log='ON';
在 Load data 的时候截获的 query 部分如下,
......
2023-11-20T02:58:32.744156Z     7 Connect   root@172.18.0.3 on benchmark using SSL/TLS
2023-11-20T02:58:32.744534Z     7 Prepare   SELECT timestamp, value FROM objects WHERE id=?
2023-11-20T02:58:32.744752Z     7 Prepare   SELECT timestamp, value FROM edges WHERE id1=? AND id2=? AND type=?
2023-11-20T02:58:32.745009Z     7 Prepare   INSERT INTO objects (id, timestamp, value) VALUES (?, ?, ?)
2023-11-20T02:58:32.745244Z     7 Prepare   INSERT INTO edges (id1, id2, type, timestamp, value) SELECT ?, ?, ?, ?, ? WHERE NOT EXISTS (SELECT 1 FROM edges WHERE id1=? AND type=0 OR id1=? AND type=2 OR id1=? AND id2=? and type=1 OR id1=? AND id2=?)
2023-11-20T02:58:32.745433Z     7 Prepare   INSERT INTO edges (id1, id2, type, timestamp, value) SELECT ?, ?, ?, ?, ? WHERE NOT EXISTS (SELECT 1 FROM edges WHERE id1=? OR id1=? AND id2=?)
2023-11-20T02:58:32.745638Z     7 Prepare   INSERT INTO edges (id1, id2, type, timestamp, value) SELECT ?, ?, ?, ?, ? WHERE NOT EXISTS (SELECT 1 FROM edges WHERE id1=? AND type=0 OR id1=? AND type=2 OR id1=? AND id2=? AND type=3 OR id1=? AND id2=? AND type=3 OR id1=? AND id2=? AND type=0)
2023-11-20T02:58:32.745954Z     7 Prepare   INSERT INTO edges (id1, id2, type, timestamp, value) SELECT ?, ?, ?, ?, ? WHERE NOT EXISTS (SELECT 1 FROM edges WHERE id1=? OR id1=? AND id2=? AND type=3 OR id1=? AND id2=? AND type=0)
2023-11-20T02:58:32.746137Z     7 Prepare   DELETE FROM objects where timestamp<? AND id=?
2023-11-20T02:58:32.746372Z     7 Prepare   DELETE FROM edges where timestamp<? AND id1=? AND id2=? AND type=?
2023-11-20T02:58:32.746579Z     7 Prepare   UPDATE objects SET timestamp=?, value=? WHERE timestamp<? AND id=?
2023-11-20T02:58:32.746834Z     7 Prepare   UPDATE edges SET timestamp=?, value=? WHERE timestamp<? AND id1=? AND id2=? AND type=?
2023-11-20T02:58:33.047484Z     7 Query INSERT INTO objects (id, timestamp, value) VALUES ('3661177412534587426', 1700449113047227370, 'kgipzrhtoyvgjrwswqvfuqsejkcffgwptytmimiuqvarcslwbaeybbtfzxlyptutyogtnuhuyyelmxeectcieiitmpdmcrfrlqfvesuzedysbbyaymmfdojrpgrrobsvnvlyrxamcfygxehsvlpuun'), ('58298810149818903', 1700449113047227370, 'kgipzrhtoyvgjrwswqvfuqsejkcffgwptytmimiuqvarcslwbaeybbtfzxlyptutyogtnuhuyyelmxeectcieiitmpdmcrfrlqfvesuzedysbbyaymmfdojrpgrrobsvnvlyrxamcfygxehsvlpuun'), ('2652373295026884086', 1700449113047256966, 'ztggpsejolmfktrdzntbpbkrvvfeeeiaheacnwmxfxauydxagxvaftjcokqiayafhcfgyuajuhuwhwjetzdtasasiixqghcbjngyrtxcoyqwkvamineivvmcauxfhshxxdxvpqzmrkxsaiekoeutiz'), ('58301009173106196', 1700449113047256966, 'ztggpsejolmfktrdzntbpbkrvvfeeeiaheacnwmxfxauydxagxvaftjcokqiayafhcfgyuajuhuwhwjetzdtasasiixqghcbjngyrtxcoyqwkvamineivvmcauxfhshxxdxvpqzmrkxsaiekoeutiz'), ('3228836246353575459', 1700449113047269260, 'enbtvltqrbkckxzxayjloymsxfgoeheyadnpvrmsxjmhwvrniskbcpxtwcmmknkckagegeqwnyxcpthxcwipdwfclfenajtjtshxkziixwwplgvewdxajudlfdfqhftclisqcfzbmajwbwbytzbkek'), ('58303208196374081', 1700449113047269260, 'enbtvltqrbkckxzxayjloymsxfgoeheyadnpvrmsxjmhwvrniskbcpxtwcmmknkckagegeqwnyxcpthxcwipdwfclfenajtjtshxkziixwwplgvewdxajudlfdfqhftclisqcfzbmajwbwbytzbkek')
2023-11-20T02:58:33.061806Z     7 Close stmt
2023-11-20T02:58:33.061850Z     7 Close stmt
......
在 Run experiment 的时候截获的 query 部分如下,
......
2023-11-20T03:16:50.470831Z    31 Query SELECT id1, id2, type FROM edges WHERE (id1, id2, type) > ('4323455642275676160','0','0') AND (id1, id2, type) < ('4755801206503243776','0','0') ORDER BY id1, id2, type LIMIT 500
2023-11-20T03:16:50.476172Z    31 Query SELECT id1, id2, type FROM edges WHERE (id1, id2, type) > ('4581502729781578811','113932998941674736','3') AND (id1, id2, type) < ('4755801206503243776','0','0') ORDER BY id1, id2, type LIMIT 500
2023-11-20T03:16:50.481455Z    36 Query SELECT id1, id2, type FROM edges WHERE (id1, id2, type) > ('6485183463413514240','0','0') AND (id1, id2, type) < ('6917529027641081856','0','0') ORDER BY id1, id2, type LIMIT 500
2023-11-20T03:16:50.482039Z    36 Query SELECT id1, id2, type FROM edges WHERE (id1, id2, type) > ('6861117988681203082','87705248627604924','1') AND (id1, id2, type) < ('6917529027641081856','0','0') ORDER BY id1, id2, type LIMIT 500
......
2023-11-20T03:20:48.673283Z    37 Query START TRANSACTION;
2023-11-20T03:20:48.673343Z    37 Query SELECT timestamp, value FROM edges WHERE id1=193061552247831207 AND id2=625408215987026639 AND type=3;
2023-11-20T03:20:48.673660Z    37 Query SELECT timestamp, value FROM edges WHERE id1=72921215231777581 AND id2=72922314743405397 AND typ
e=3;
2023-11-20T03:20:48.673728Z    37 Query COMMIT
2023-11-20T03:20:48.674338Z    37 Execute   SELECT timestamp, value FROM objects WHERE id=72921215231777581
2023-11-20T03:20:48.674917Z    37 Execute   SELECT timestamp, value FROM objects WHERE id=72921215231777581
2023-11-20T03:20:48.675250Z    37 Execute   SELECT timestamp, value FROM edges WHERE id1=1527208961461072357 AND id2=2103670813276123671 AND type=1
2023-11-20T03:20:48.675437Z    37 Execute   SELECT timestamp, value FROM objects WHERE id=72921215231777581
......
可以发现,这些查询都是 flat 的,没有任何依赖关系。
Java 实现缓存策略的 demo
这里还是使用 MySQL 作为 DB,Redis 作为缓存数据库,基于 Cache Aside 策略(旁路缓存策略)使用 java 代码实现缓存策略逻辑。
读策略:
- 如果读取的数据命中了缓存,则直接返回数据;
- 如果读取的数据没有命中缓存,则从数据库中读取数据,然后将数据写入到缓存,并且返回给用户。
写策略:
- 先更新数据库中的数据,再删除缓存中的数据。
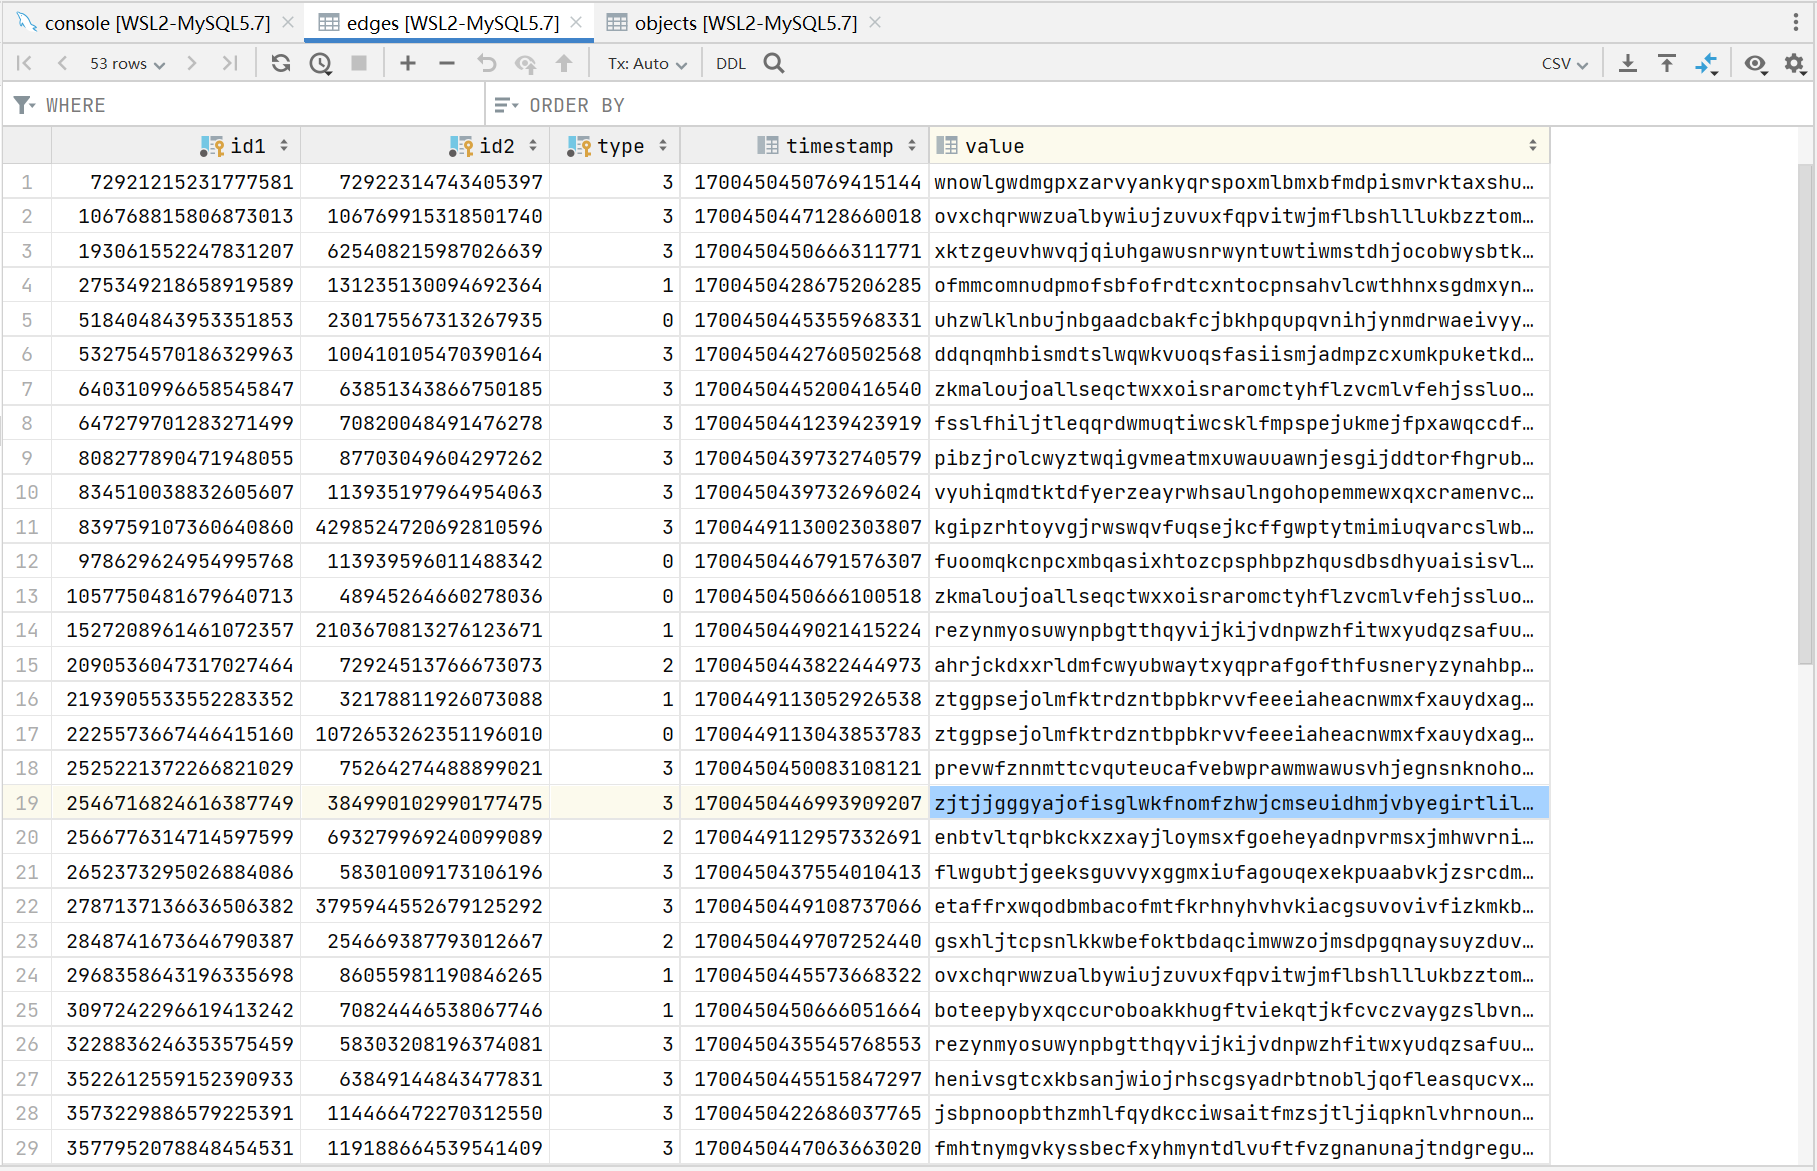
Redis 的 key 和 value 分别存什么呢?实际上这部分可以自行设计。例如对于下面的查询语句和更新语句(摘自 TAObench 的 query):
SELECT timestamp, value FROM edges WHERE id1=? AND id2=? AND type=?;
UPDATE edges SET timestamp=?, value=? WHERE timestamp<? AND id1=? AND id2=? AND type=?;
key 为了避免重复,可以设置为主键或者与主键相关连,也可以把参数确定的 SQL 语句直接作为 key,或者设置为 SQL 语句的 hash 值。在本例中,我把 "edges:" + id1 + ":" + id2 + ":" + type作为 key。
value 的话对于一般情况,一个常见的做法是序列化这些结果为一个字符串,然后将这个字符串存储到 Redis 中。在本 demo 中,由于查询结果只有一行,为了简单起见,直接把这一行存入 Redis 即可。
代码如下(需要 JDBC 和 Jedis 支持):
import redis.clients.jedis.Jedis;
import java.sql.*;
public class DBcacheTest {
private static final String MYSQL_URL = "jdbc:mysql://localhost:3306/benchmark";
private static final String MYSQL_USER = "root";
private static final String MYSQL_PASSWORD = "123456";
private static final String REDIS_HOST = "localhost";
private static final int REDIS_PORT = 6379;
public static void query(long id1, long id2, long type) {
try {
Jedis jedis = new Jedis(REDIS_HOST, REDIS_PORT);
String cacheKey = "edges:" + id1 + ":" + id2 + ":" + type;
String cachedValue = jedis.get(cacheKey);
if (cachedValue != null) {
System.out.println("Cache Hit: " + cachedValue);
return;
}
try (Connection conn = DriverManager.getConnection(MYSQL_URL, MYSQL_USER, MYSQL_PASSWORD);
PreparedStatement stmt = conn.prepareStatement("SELECT timestamp, value FROM edges WHERE id1=? AND id2=? AND type=?")) {
stmt.setLong(1, id1);
stmt.setLong(2, id2);
stmt.setLong(3, type);
// System.out.println("Query DB: " + stmt.toString());
ResultSet rs = stmt.executeQuery();
if (rs.next()) {
long timestamp = rs.getLong("timestamp");
String value = rs.getString("value");
String dbValue = timestamp + "," + value;
System.out.println("DB Hit: " + dbValue);
jedis.set(cacheKey, dbValue); // 更新缓存
}
}
} catch (Exception e) {
e.printStackTrace();
}
}
public static void update(long newTimestamp, String newValue, long oldTimestamp, long id1, long id2, long type) {
try {
Connection conn = DriverManager.getConnection(MYSQL_URL, MYSQL_USER, MYSQL_PASSWORD);
PreparedStatement stmt = conn.prepareStatement("UPDATE edges SET timestamp=?, value=? WHERE timestamp<? AND id1=? AND id2=? AND type=?");
conn.setAutoCommit(false); // 开启事务
stmt.setLong(1, newTimestamp);
stmt.setString(2, newValue);
stmt.setLong(3, oldTimestamp);
stmt.setLong(4, id1);
stmt.setLong(5, id2);
stmt.setLong(6, type);
int affectedRows = stmt.executeUpdate();
conn.commit();
if (affectedRows > 0) {
try (Jedis jedis = new Jedis(REDIS_HOST, REDIS_PORT)) {
String cacheKey = "edges:" + id1 + ":" + id2 + ":" + type;
jedis.del(cacheKey); // 删除缓存
}
}
} catch (Exception e) {
e.printStackTrace();
}
}
public static void main(String[] args) {
System.out.println("Test Begin!");
// 测试查询
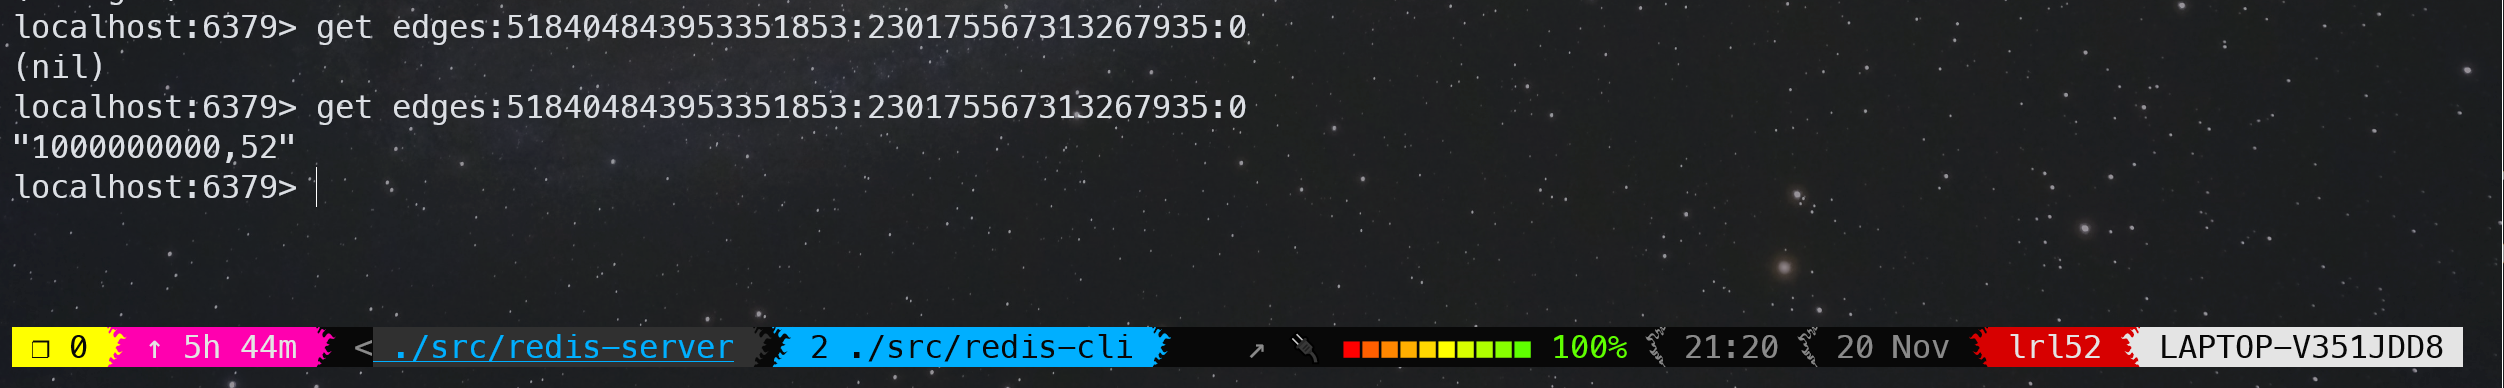
query(518404843953351853L, 230175567313267935L, 0);
query(518404843953351853L, 230175567313267935L, 0);
// 测试更新
update(1000000000L, "52", 1700450445355968331L + 1,
518404843953351853L, 230175567313267935L, 0);
// 测试查询
query(518404843953351853L, 230175567313267935L, 0);
query(518404843953351853L, 230175567313267935L, 0);
}
}
运行的结果如下:
Test Begin!
DB Hit: 1700450445355968331,uhzwlklnbujnbgaadcbakfcjbkhpqupqvnihjynmdrwaeivyykrmmenbjggppyhtahtdjdzumvtipqebotzvfsnabwkhakubazrpnurfmthjgrhhxawlhzazdsttdgfwwhkaorqvptfyrebpyuqcoh
Cache Hit: 1700450445355968331,uhzwlklnbujnbgaadcbakfcjbkhpqupqvnihjynmdrwaeivyykrmmenbjggppyhtahtdjdzumvtipqebotzvfsnabwkhakubazrpnurfmthjgrhhxawlhzazdsttdgfwwhkaorqvptfyrebpyuqcoh
DB Hit: 1000000000,52
Cache Hit: 1000000000,52
从结果中可以发现,在 update 前的两次查询中,第一次查询需要 query db,第二次查询就 cache hit 了。update 后的两次查询亦是如此。
从 Redis 中也可以看到,一开始不存在缓存数据,查询之后,就可以查到缓存数据了:
Greedy-Dual-Size-Frequency 缓存算法论文阅读
由于大多数 Web documents 都是静态的,因此在 HTTP proxies 上缓存它们可以减少网络流量和请求响应时间。早期实验研究表明,Web proxy 的缓存命中率能高达 50%,可以潜在减少 20% 的网络流量。
Web 缓存相较于计算机系统中的传统缓存有以下三个区别与挑战:
- HTTP 协议仅支持完整文件传输,Web 代理缓存仅当整个文件被缓存时才能满足请求
- 缓存中的 Web 静态文件大小差异很大,而传统缓存(CPU 缓存和虚拟内存)都是处理统一大小的缓存页
- 传统缓存的访问流可能表现出一些特定的规律,因为它仅由系统当前运行的一个或几个应用程序生成。Web 缓存的访问流是成百上千的用户客户端请求的“合集”
已有的缓存算法合集
下面对一系列传统和新兴缓存算法做个简要总结:
- Least-Recently-Used (LRU):替换最近最久未被访问的文件。
- 缺点:Web 缓存表现不佳,因为仅看局部访问时间,流量特征会有很大不同。
NOTE:个人理解就是 LRU 仅仅考虑了时间局部性,没有考虑到 frequency 和 size,所以表现不佳
- Least-Frequently-Used (LFU):替换访问频率最少的文件。
- 缺点:某些文件可能在短时间内被高频访问,并且永远不会被再次访问,这些文件会污染缓存。
NOTE:个人理解就是 LFU 仅考虑了 frequency,在适应新的流量特征下响应比较慢
- SIZE:替换 SIZE 最大的文件
- 缺点:可能一些进入缓存的小文档永远不会被再次访问,从而导致缓存污染
NOTE:虽然算法思想真的很简单,但是从后文可以看到 SIZE 还是 outperform 了很多普通算法
- LRU-Threshold:在 LRU 的基础上增加了一个 threshold size,文件大小超过 threshold size 的将不会被缓存
-
Log(Size) + LRU:在最大的 Log(Size) 缓存集合中,依照 LRU 进行驱逐。
NOTE:个人猜测就是通过 Log 把 Size 进行分层,同时考虑到了 Size 和时间局部性
- Hyper-G:LFU 算法的改进,考虑了上次访问时间和 Size。具体算法没有详细介绍。
-
Pitkow/Recker:该算法试图捕捉 Web 文件的每日访问模式,一天仅运行一次。替换时策略遵照 LRU,如果所有文件都被访问过了,则替换最大的文件。
-
Lowest-Latency-First:替换下载延迟最低的文件。算法旨在最小化平均延迟。
-
Hybrid:这是一个融合算法,也旨在降低平均延迟。$c_s$ 表示连接到服务器 s 的时间,$b_s$ 代表服务器 s 的带宽,$fr_f$ 代表文件 f 的访问频率,$size_f$ 代表文件大小(单位:字节),那么一个文件 $f$ 的贡献值计算公式如下:
$$
\small \dfrac{(c_s + K_1 / b_s) \times (fr_f)^{K_2}}{size_f}
$$
其中 $K_1, K_2$ 是常数,$c_s, b_s$ 可以根据过去一段时间从服务器 $s$ 获取文件的延迟情况来估算 -
Lowest Relative Value (LRV):这个算法通过统计学来预测未来访问的概率,是一个考虑了 cost,size 和访问概率的融合算法。设 $P_i$ 表示一个文件在访问了 $i$ 次后再被访问 $i+1$ 次的概率(相当于是个条件概率),$D_i$ 表示到目前为止有多少个文件至少被访问了 $i$ 次,则 $P_i = D_{i+1} / D_i$。$P_i(size)$ 表示仅考虑大小为 size 的文件在访问了 $i$ 次后再被访问 $i+1$ 次的概率。此外,设 $1-D(t)$ 表示一个文件访问后在 $t$ 秒后再被访问的概率,$D(t)$ 的估计函数如下:
$$
D(t) = 0.035\log(t+1) + 0.45(1 – e^{\frac{-t}{2\times 10 ^6}})
$$
对于一个大小为 size 的文件,请求代价为 cost,在过去已经访问了 $i$ 次,它的相对价值函数 $V$ 的计算公式如下:
$$
V(i, t, size) =
\begin{cases}
P_1(size) \times (1 – D(t)) \times cost / size, & \text{if }i\text{ = 1} \\
P_i \times (1 – D(t)) \times cost / size & \text{otherwise}
\end{cases}
$$
经过 performance studies,
- 在 hit ratio 上:LRV > SIZE > LFU,LRU-Threshold, Log(size)+LRU, Hyper-G 和 Pitkow/Recker。在大多数情况下 SIZE 也比 LRU 表现更好
- 在 byte hit ratio 上:LRV > LRU > SIZE
- 在 minimizing latency 上:Hybrid > Lowest-Latency-First
综上,Web 缓存能用的算法就只有 LRU、SIZE、Hybrid 和 LRV。Hybrid 和 LRV 算法由于参数很多,往往只能作为一个最佳理论界限,而不是实际的选择。
NOTE:不难发现,这些算法就是 LRU、LFU、SIZE、Lowest-Latency-First 几个最基本算法的各种组合和融合,从本质上说就是对 recency、frequency、size、cost 四个关键参数的权重分配来评估一个文件的缓存价值。
NOTE:cost 的定义是 costs to fetch them from the secondary storage,个人理解 cost 与网络带宽、磁盘 I/O 性能有关。
NOTE:hit ratio 表示缓存命中的请求数占总请求的百分比,byte hit ratio 表示缓存传输的字节数占所有请求总字节数的百分比。通常高命中率是首选,因为它允许从代理缓存中满足更多数量的客户端请求,并最大限度地减少平均请求延迟。而最小化网络流量对应更高的字节命中率。
原始的 Greedy-Dual 算法
定义 $H$ 初始表示将一个页面放入缓存的 cost。
当需要替换时,H 值最低的页面被替换,然后所有页面的成本值 H 减少 $\min_H$。如果某个页面再次被访问,则其当前成本值 H 将恢复为将此页面放入高速缓存的原始成本。这样,最近访问过的页面的 H 值相对于长时间未访问过的页面维持了更大的成本,相对不容易被替换掉。
该算法首先使用 H 值最低的页面进行替换。这些要么是进入缓存 cost 最“便宜”的页面,要么是很长时间没有被访问的页面。
该算法有一种不同的、有效的实现,使用优先级队列并为 H 的未来设置保留偏移值。
NOTE:每次将所有页面的成本值都减少 $\min_H$ 难以高效实现,很容易想到可以维护一个全局变量,表示偏移量 H 减少的和。但是这样的话有些页面被访问过了就不需要减去偏移量了。于是可以反过来,让访问的页面加上一个 $\min_H$,这其实就是之前 DeTox 算法的全局老化因子 $A_{global}$,也对应本文后面的 $\mathtt{CLOCK}$。
Greedy-Dual-Size 算法
考虑到 Web 缓存涉及存储不同大小的文件,GDS 算法在 GD 算法的基础上添加了 size 参数。即是把 H 函数改成了
$$
H = \frac{cost}{size}
$$
cost 函数可以定义为如下,它代表了请求一个文件估计的网络包收发数量:
$$
cost = 2 + \frac{size}{536}
$$
特别地,令 cost 为常数 1,得到 GD-Size(1) 算法,该算法有最高的 hit ratio。
GDS 算法的缺点:它不考虑文档过去被访问的次数。
Greedy-Dual-Size-Frequency 算法
不难想到,GDSF 算法就是在 GDS 的基础上再加上 frequency 参数。在完整算法的描述中,作者还加入了 $\mathtt{CLOCK}$ 因子(与上篇论文的 $A_{global}$ 的定义和作用相同,这里不在赘述)。定义一个文件 $f$ 的 priority key 为:
$$
Pr(f) = \mathtt{CLOCK} + Fr(f) \times \frac{Cost(f)}{Size(f)}
$$
在原论文中,作者以比较严格地方式详细描述了 GDSF 算法的整个流程,具体详见 paper,这里写懒得写了。
将 cost 令为常数 1,得到 GD-Size-Frequency(1),$Pr(f)$ 计算公式如下:
$$
Pr(f) = \mathtt{CLOCK} + Fr(f) \times \frac{1}{Size(f)}
$$
与大文件相比,GD-Size-Frequency(1) 为小文件分配更大的 priority,旨在通过在替换文档时最小化丢失率来最大化命中率。
没看出这么做有什么特别的优点。
Greedy-Dual-Frequency 算法
在原始 GD 算法的基础上引入 frequency,又能得到一个改版算法:
$$
Pr(f) = \mathtt{CLOCK} + Fr(f) \times {Cost(f)}
$$
展望与总结
还可也怎样魔改那个 $Pr(f)$ 计算公式呢?
例如,$\mathtt{CLOCK}$ 因子从 0 开始增大,它是一个单调递增的参数,但是它的增长速度非常慢。我们可以设计一个更快增长的 clock function,这样会让 recency 有更大的权重,也会使算法更接近 LRU。
此外也可以给 $Size(f)$ 或者 $Fr(f)$ 函数取对数,从而减少对应参数的权重。
“如果了解有关工作负载的更多详细信息,并使用它来强化公式中正确参数的影响,那么调整该算法以实现最佳性能是一个有趣的问题。”
TAOBench 论文阅读
大型社交网络应用程序的不断出现带来了巨大的数据规模和查询量,挑战了现有数据存储的极限。然而,很少有基准测试能准确模拟这些请求模式,导致研究人员缺乏评估和改进这些系统的工具。在本文中,我们提出了一个新的基准测试 TAOBench,它捕获了 Meta 上的社交图工作负载。
全面的社交网络基准测试应该抓住下面这 5 个社交网络请求:
- 准确模拟社交网络请求
-
满足任何事务需求
事务是社交网络工作负载的关键组成部分。然而在现有的社交网络 benchmark 中,只有 LDBC 包含(read-write)事务。TAO 提供了 one-shot 的 read-only 和 write-only 事务,以提高性能和可扩展性。
- 支持个性化数据分区的存储和约束
-
在没有规定查询类型的情况下,能够对请求分布进行建模
-
在共享数据上展示用户群体的行为:
运行混合工作负载并不一定反映不同应用程序在现实世界数据上的实际交互方式。在生产中,我们发现应用程序可以访问相同的数据,从而影响其他产品的行为。
TAO
TAO 每秒在数 PB 的变化数据集上提供超过 100 亿次读取和数千万次写入服务。
TAO 的 API 包括点获取、范围和计数查询、插入、更新和删除对象和关联操作,以及可能失败的原子写入(multi-put)事务。大多数产品开发人员通过两个 higher-level 查询框架之一访问 TAO,这使得在社交图上表达复杂的操作变得容易。在这两个接口中,它将复杂的查询分解为对 TAO 的数百个读取和数十个写入。
WORKLOAD CHARACTERIZATION
99.6% 的在事务中被高频 write 的 key,每天的平均 read 次少于 1 次。另外,key 在分区中的分布并不均匀。他们分析的某个特定产品组(product group)中,超过93.9%的数据项(them)与至少一个其他频繁请求的数据项位于同一位置(colocated)。换句话说,大多数数据项并不是孤立存在的,而是与其他经常被访问的数据项共同存储在相同的物理或逻辑位置。
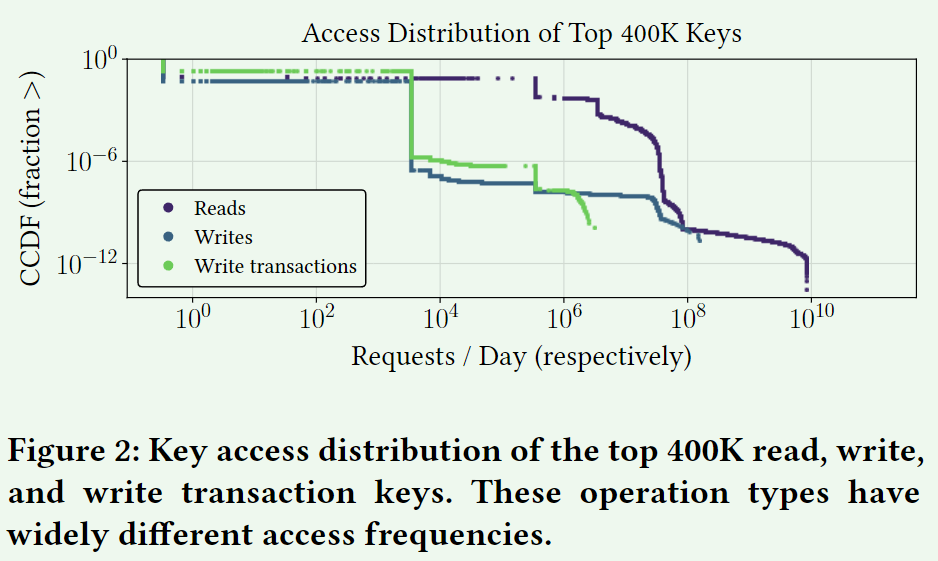
我们发现读取、写入和写入事务之间的 key 访问分布、热点和请求延迟有所不同。此外,不同层之间的流行读取 key 也有所不同。具体而言,可以总结为以下几点:
- Key access distributions:读取、写入和写入事务具有显著不同的 key access pattern。
在 Top 400K keys 中,90%的 read 请求频率都不超过 3.3
M 次/天, write 和 write transaction 请求频率不超过 3.3K 次/天。
-
Hotspots:读写事务的 hotspots 并不总是一致的。
-
Reads across tiers:读取的 key 访问分布在层之间有所不同。
-
Request latency:由于缓存不命中和跨区域请求,读取和写入(事务)延迟分布是双峰的。
Write Transactions
具体来说,我们分析了 TAO 上三个主要产品组执行的事务的大小、争用、分片和偏差。
- Product groups:交易高度倾斜并且因应用程序而异
-
Transaction size:写入事务可以跨越许多键和分片
- Contention:不同 key 类型的争用差异很大,作为不同应用程序用例的代理
- Contention and colocation:写入事务中的热键往往位于相同的分片上
- Distinct transactional access patterns:事务表现出跨产品组的独特请求模式
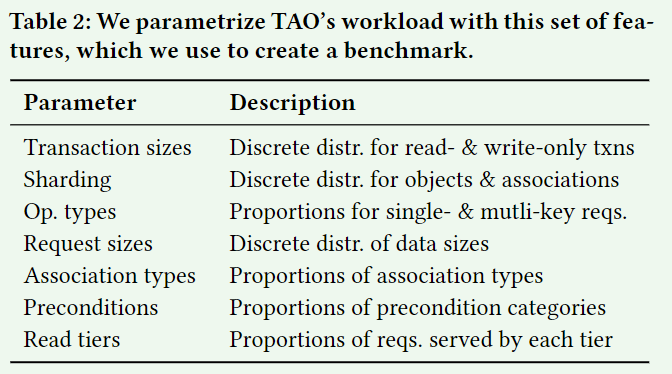
Workload Parameters
BENCHMARK
Request API
read(key): Read a record
read_txn(keys): Read a group of records atomically
write(key,[preconditions]): Write to a record, optionally with a set of preconditions
write_txn(keys,[preconditions]): Write to a group of records atomically, optionally with a set of preconditions
Architechture
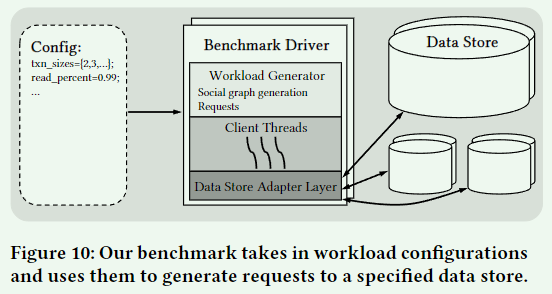
Extensibility
我们的基准 API 是大多数数据库接口的子集,因此扩展到新系统很简单。TAOBench 的大部分请求都可以直接转换为相应的 SQL 查询。
References
华为云 – 三种缓存策略:Cache Aside 策略、Read/Write Through 策略、Write Back 策略